Support Vector Machines (SVM)
A Simple Guide to How SVMs Uses Data to Make Predictions
Understanding SVMs
Support Vector Machines are machine learning models used for tasks like classifying emails as spam or not spam, or deciding whether a tumor is cancerous or not.
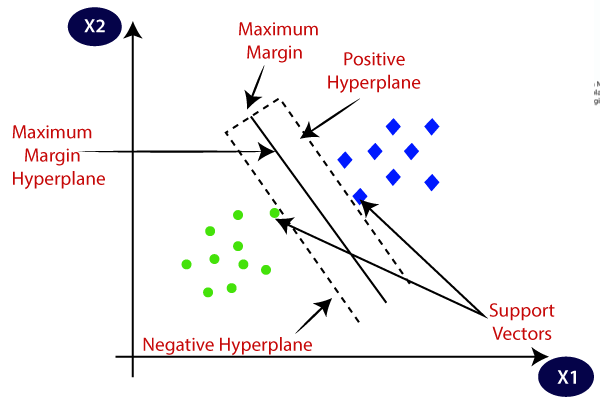
The main idea is to draw a boundary (called the hyperplane) between two groups of data in a way that separates them as clearly as possible.
Let’s say you have two groups of points — green and blue — plotted on a 2D graph. You want to find a straight line that divides the red points from the blue points.
There are many lines you could draw, but SVM doesn’t just want any line. It wants the best one — the one that:
Separates the two groups clearly, and
Leaves the biggest possible gap between them.
The margin is the distance between the dividing line (called the hyperplane) and the closest points from each group, known as support vectors.
SVM tries to maximize this margin because the farther the boundary is from both groups, the less likely the model is to make mistakes on new, unseen data — making it more reliable and generalizable.
What If the Data Can’t Be Split by a Straight Line?
In the real world, things aren’t always so tidy. Sometimes the two classes are mixed in a way that no straight line can separate them.
That’s when SVMs use something called a kernel function.
A kernel function transforms the data into a higher-dimensional space where a straight line can separate them.
A kernel may combine certain features or uncover complex interactions between them, transforming the data into a new, higher-dimensional space.
In this new space, patterns that were tangled or inseparable in the original data can now be divided cleanly — allowing the SVM to draw an effective boundary between classes and make accurate predictions.
SVM Example
Let's say you work in healthcare, you’re given a dataset of tumor records. Each record includes features like:
Size of the tumor
Shape smoothness
Texture
Cell density
Growth rate
Each tumor is labeled as benign (non-cancerous) or malignant (cancerous).
You train an SVM model to separate benign from malignant tumors by drawing the best boundary between the two types in feature space. SVM finds the hyperplane that maximizes the margin — meaning it places the boundary as far away as possible from both groups’ closest tumors (the support vectors).
If the boundary isn’t clear-cut, a kernel function helps the model find a complex, curved separation in a higher-dimensional space.
For example:
Two tumors might look very similar in terms of size and shape, but very different when you combine shape × texture.
The kernel creates new feature combinations like that, making it easier to find patterns that were hidden in the original space. As a result, the SVM can draw a more accurate boundary that separates benign from malignant cases — even when the relationship between features is nonlinear.
Connect with Me!
LinkedIn: caroline-rennier
Email: caroline@rennier.com