Logistic Regression Explained
A concise overview of logistic regression as a binary classification supervised learning algorithm.
Understanding Logistic Regression
Logistic regression calculates the probability that a data point belongs to one of two classes—for example, diabetic vs. non-diabetic. Each input feature (such as BMI, blood pressure, age, and family history) is assigned a weight based on how strongly it contributes to predicting whether a person has diabetes.
For each data point, the model multiplies each feature value by its weight and then adds them all together. This total score gets passed through a sigmoid function, which turns it into a probability between 0 and 1.
If the probability is above a certain threshold—usually 0.5—the model classifies the data point as a 1 (e.g., has diabetes). If it’s below 0.5, it’s classified as a 0 (e.g., does not have diabetes).
An Example of Logistic Regression
Let's say, you want to use logistic regression to predict whether or not someone has diabetes. Logistic regression will use personal information to predict diabetes diagnosis, utilizing data like:
Body Mass Index
Blood Pressure
Family History (0 or 1)
Age
Predicting: Diabetes Diagnosis (0 or 1)
Logistic Regression builds a model like this:
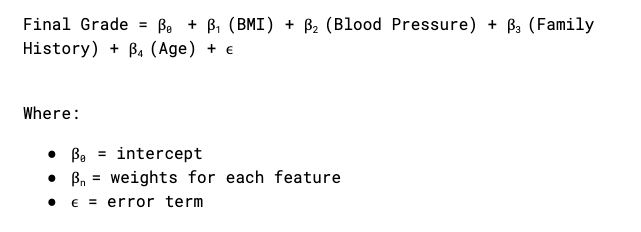
Let's say the model finds these coefficients:
Diabetes Score = 15+ 0.6(BMI) - 0.3(Blood Pressure) + 5(Family History) + 0.2(Age)
And you plug in a patient, Jack:
BMI: 27
Blood Pressure: 130
Family History: 1 (yes)
Age: 20
Jack's Diabetes Score: 15+ 0.6(27) - 0.3(130) + 5(1) + 0.2(20) = 1.2
Next you must pass this score to the sigmoid function to get a probability:
Plugging Jack’s score of 1.2 into the sigmoid function yields a result of 0.768, indicating a 76.8% probability that Jack has diabetes. Based on this, the model predicts an outcome of 1, predicting Jack has diabetes.


Connect with Me!
LinkedIn: caroline-rennier
Email: caroline@rennier.com