Linear Regression Explained
A Simple Guide to How Linear Regression Uses Data to Make Predictions
Understanding Linear Regression
Linear regression is used when the goal is to predict a numeric outcome—like price, score, or quantity—based on a set of input features.
It assumes that there’s a straight-line relationship between the inputs and the output.
Each input feature is assigned a weight that reflects its influence on the outcome. Features with a stronger relationship to the target variable will be assigned larger weights, while less relevant features will have smaller or near-zero weights.


Demonstrating Linear Regression
Let's say, you want to use linear regression to predict the final grade a student will receive in a course based on features like attendance rate, homework scores, and midterm exam performance.
Attendance rate (e.g., 0.95 means 95% attendance)
Homework average (e.g., out of 100)
Midterm exam score (e.g., out of 100)
Age (e.g., in years)
Linear regression builds a model like this:
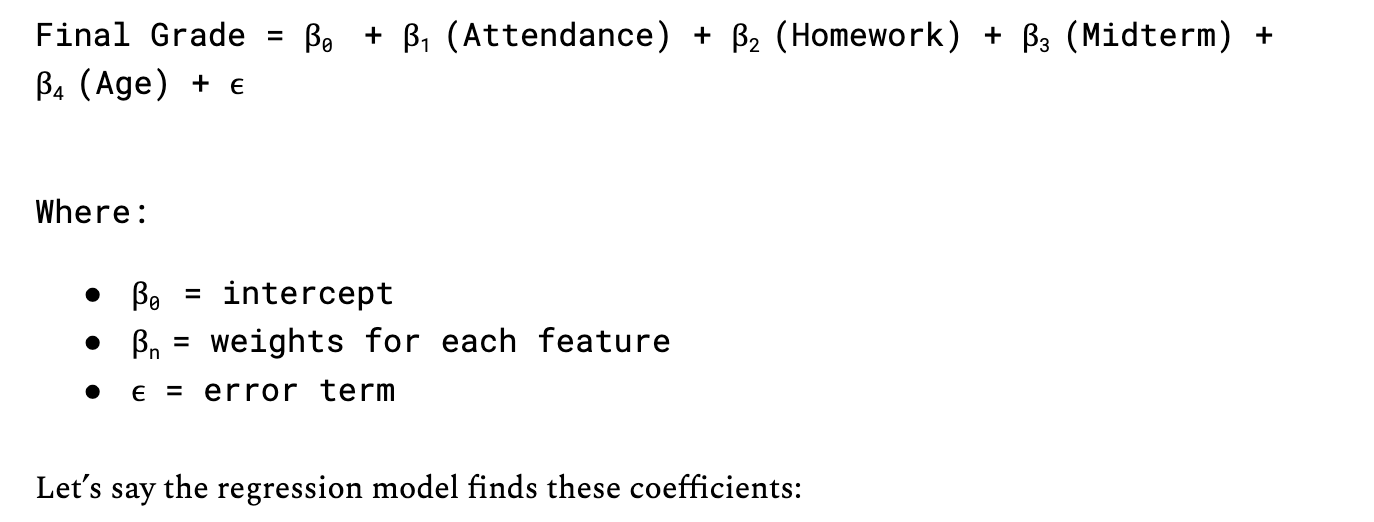
Let’s say the regression model finds these coefficients:
Final Grade = 5 + .1(Attendance) + 0.4(Homework) + 0.5(Midterm) + .002 (Age)
And you plug in a student:
Attendance = 90
Homework = 85
Midterm = 88
Age = 21
Predicted Grade = 5 + .1(90) + 0.4(85) + 0.5(88) + 0.02(21) = 92.42
What This Tells Us:
Midterm scores and homework have a strong positive influence — higher scores → higher predicted grades
Age has almost no effect — its weight is very small (0.02)
So, the model learns which features matter most. For example, age has little impact, while midterm scores and attendance have a stronger influence on the predicted final grade.
Connect with Me!
LinkedIn: caroline-rennier
Email: caroline@rennier.com