Hierarchical Clustering
An unsupervised machine learning technique that builds a multi-level hierarchy of clusters by repeatedly merging or splitting groups based on their similarity.
Understanding Hierarchical Clustering
Hierarchical clustering is a method used to group similar data points together without needing labels. It’s called unsupervised because it doesn’t rely on any predefined categories.
Instead of creating a fixed number of groups (like k-means does), hierarchical clustering builds a tree-like structure of groups within groups. This structure, called a dendrogram, shows how data points are grouped step by step—beginning with every point in its own separate cluster, and gradually merging the most similar ones into larger and larger clusters.
There are two main ways to build this:
Agglomerative (bottom-up): Start with each point in its own cluster and keep combining the closest ones.
Divisive (top-down): Start with all points in a single cluster and repeatedly split it into smaller subgroups.
Most of the time, the bottom-up (agglomerative) method is used because it’s simpler and more intuitive.
One of the key advantages of hierarchical clustering is that you don’t need to choose the number of clusters ahead of time. Instead, you can explore the dendrogram and decide how many clusters you want by “cutting” the tree at different levels—depending on how fine-grained or broad you want your groupings to be.
How it Works: Agglomerative Hierarchical Clustering
Initialization:
Every data point starts as its own cluster. So if you have 100 data points, you start with 100 clusters.
Distance Calculation:
Compute the pairwise distance between all clusters. In the first step, this means the distance between all pairs of individual points. You can define distance in various ways:
Euclidean distance
Manhattan distance
Cosine similarity (for high-dimensional data)
Linkage Criteria:
Decide how to measure the distance between clusters, not just between points. Common methods:
Single linkage: distance between the closest pair of points from each cluster.
Complete linkage: distance between the farthest pair of points.
Average linkage: average distance between all point pairs across two clusters.
Ward’s method: chooses the pair of clusters whose merger
minimizes the increase in total within-cluster variance (SSE).
Merge Step:
Identify the two closest clusters using the chosen
linkage method and merge them. Now the number of
clusters decreases by 1.
Update Distance Matrix:
Recalculate the distances between the new cluster
and all other clusters.
Repeat:
Keep merging until only one cluster remains that
contains all data points.
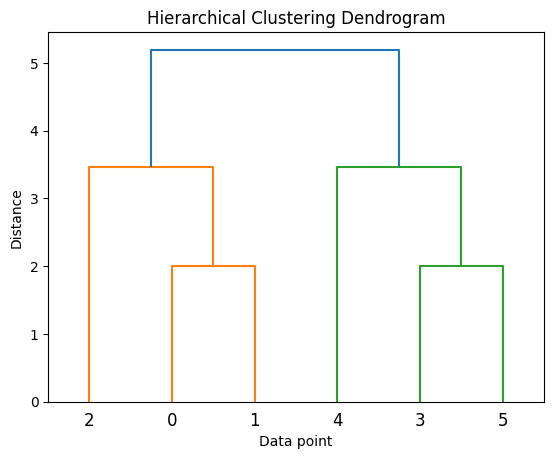
Output: The Dendrogram
The algorithm produces a dendrogram, a tree-like diagram where:
Each leaf represents a data point.
Branches show cluster merges.
The height of a merge shows the distance (or dissimilarity) between clusters.
By “cutting” the dendrogram at a chosen height, you can extract the number of clusters that best represent your data.
Example: Clustering Animals
You have a dataset of animals with features like:
Number of legs
Has feathers
Is vertebrate
Can fly
Type of body covering
You don’t label them, but you want to group them based on similarity.
Here’s how agglomerative hierarchical clustering would work, bottom-up:
Step 1: Start with each animal as its own cluster
At the bottom of the diagram, each animal is its own group:
Eagle
Peacock
Lion
Bear
Spider
Scorpion
Step 2: Merge the most similar animals first
Eagle and Peacock share similar features (birds, feathers, wings).
→ They get merged into a “Birds” cluster.
Lion and Bear share mammalian traits (fur, four legs, vertebrates).
→ Merged into a “Mammals” cluster.
Spider and Scorpion both have more than 3 legs, jointed limbs, and no backbone.
→ Merged into a “More than 3 legs” group.
Step 3: Merge higher-level clusters
Birds and Mammals are both vertebrates, meaning they have a backbone.
→ Merged into a “Vertebrates” cluster.
Step 4: Final merge
The Vertebrates cluster and the More than 3 legs cluster are finally merged into one large group: “Animals”.
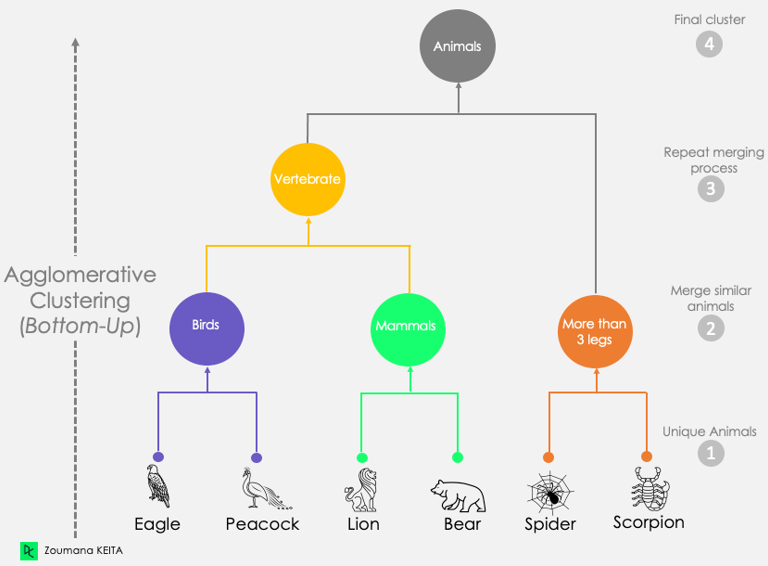
Source: Zoumana Keita -Data Camp
Connect with Me!
LinkedIn: caroline-rennier
Email: caroline@rennier.com