Data Preprocessing
Getting raw data ready for analysis by handling issues like missing values, inconsistent formats, and scaling, so it can be used effectively in models or reports.
Data preprocessing is the process of cleaning, transforming, and organizing raw data into a format that’s ready for analysis, visualization, or modeling.
Whether you’re working on a simple report, building dashboards, running statistical tests, or training machine learning models—preprocessing is the essential first step.
Raw data is often messy. It might include missing values, inconsistent formats, duplicate entries, or outliers. If left untreated, these issues can lead to misleading conclusions or unreliable results.
Overview
Preprocessing helps you:
Improve the quality and reliability of your analysis
Ensure your data is consistent and structured
Make different datasets compatible with each other
Reduce errors in decision-making or model outputs
Get your data into a form that tools and algorithms can actually work with
Typical Preprocessing Tasks Include...
Removing or imputing missing values
When you’re working with real-world data—like survey results, sales logs, or website activity, it’s very common to find missing values.
There are some different ways to handle these values:
Remove rows containing null values: This method deletes any row with missing data, but not ideal if a large portion of your dataset has nulls or if you’re working with limited data.
Replace with column mean or median: Fill in missing values with the average (mean) or middle value (median) of that column.
K-Nearest Neighbors (KNN):
Instead of using a global average or median, KNN looks at a defined number of “neighbors” (often 3, 5, or 10) that are closest to the row with missing data—measured by distance metrics like Euclidean distance.
It then uses the values from these similar rows to estimate the missing one, either by averaging (for numeric data) or taking the most frequent value (for categorical data).
Replace with a Universal Value: Filling in all missing entries with a fixed placeholder, such as 0 for numerical data or "Unknown" for categorical data.
Standardizing Formats
When working with data, it’s common to find inconsistent formats—especially in text fields like dates, names, or categories. These inconsistencies don’t change the meaning, but they make analysis harder or cause errors.
Example: Date Formats
"01/05/2024"
"2024-01-05"
"January 5, 2024"
These all mean the same thing, but if they’re not standardized, your software might treat them as different values—or fail to process them at all.
Therefore, you need to convert all dates to the same format, like "YYYY-MM-DD" (e.g., 2024-01-05)
Example: Test Casing
Say you have a column for favorite fruit:
"apple", "Apple", "APPLE"
These should be the same category, but your program may treat them as three different ones.
You need to convert all text to lowercase or uppercase before analysis.
In addition to fixing formats and casing, you may also need to remove extra symbols that can interfere with analysis:
Extra symbols like dollar signs ($), percentage signs (%), or punctuation can interfere with analysis.
These symbols often appear in fields like prices (e.g., $100) or percentages (e.g., 45%).
While helpful for humans, these characters can confuse software that expects plain numbers.
Cleaning involves trimming spaces, removing or replacing symbols, and converting values to standard numeric form.
Encoding categories into numerical form
Most machine learning models can’t understand text, they need numeric features. That’s why we convert (or encode) categorical data, like “red”, “blue”, or “green”, into a numerical format.
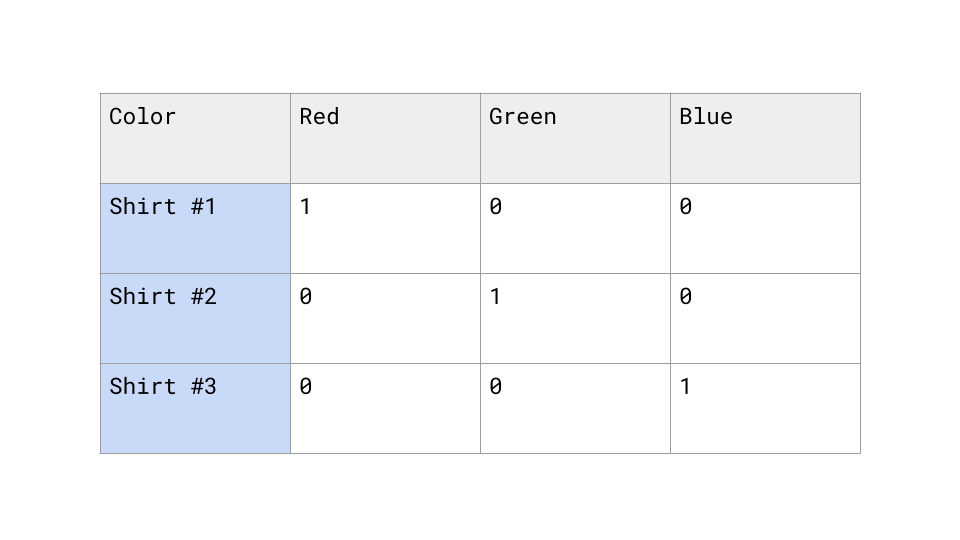
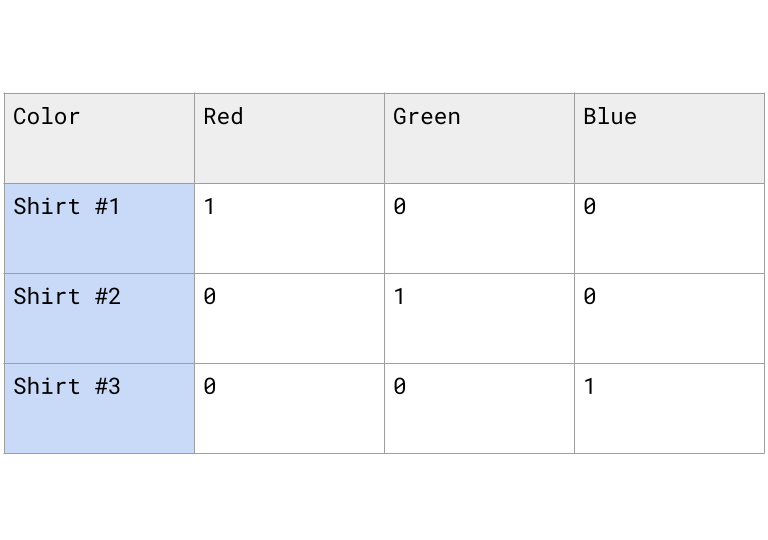
One - Hot Encoding:
Let’s say you have a dataset like this:
Shirt color:
Red
Blue
Green
If you try to feed this into a model as-is, it won’t know what to do with “Red” or “Blue.” We need to convert these categories into numbers so the model can work with them.
We can treat each category becomes its own column. You put a 1 in the column that matches the row’s value and 0 in the others.
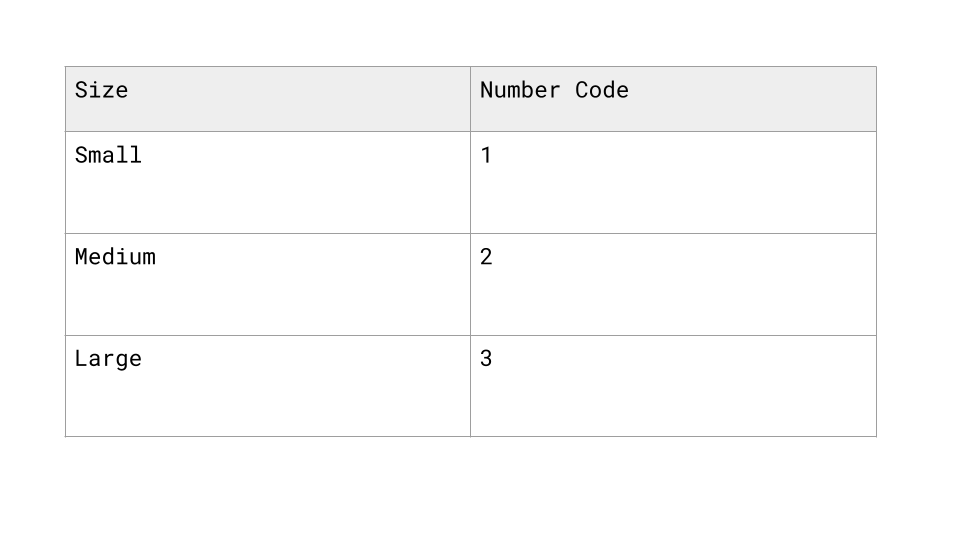
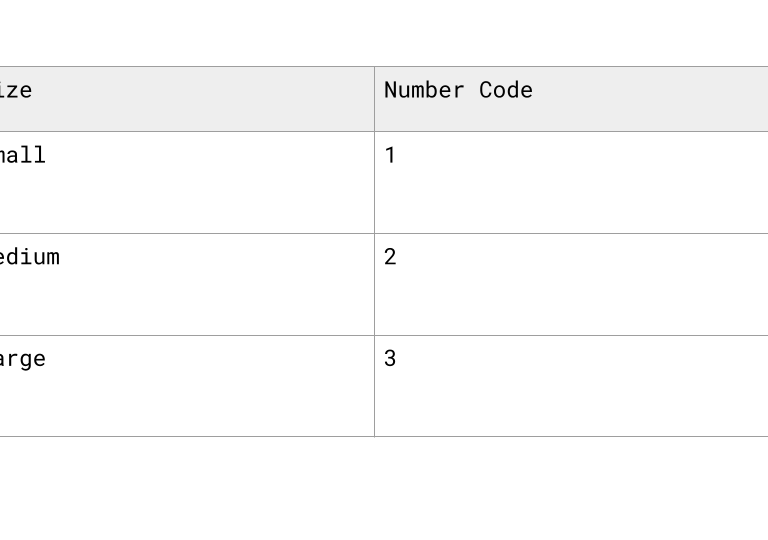
Ordinal Encoding
Assigns a numerical value to each category based on its order or rank.
It’s used when the categories have a meaningful sequence - like “low,” “medium,” and “high”—so the numbers reflect that order (e.g., 1, 2, 3).
Scaling or Normalizing Numeric Data
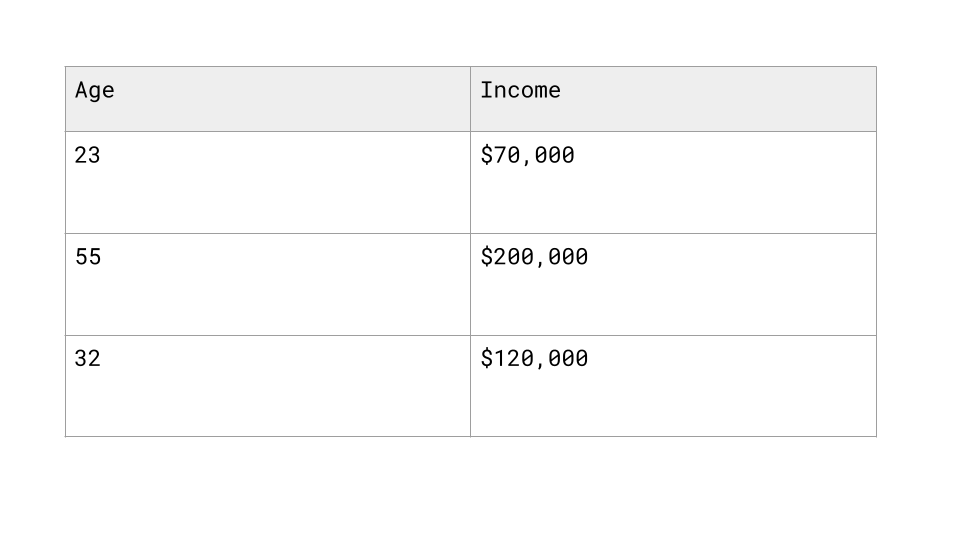
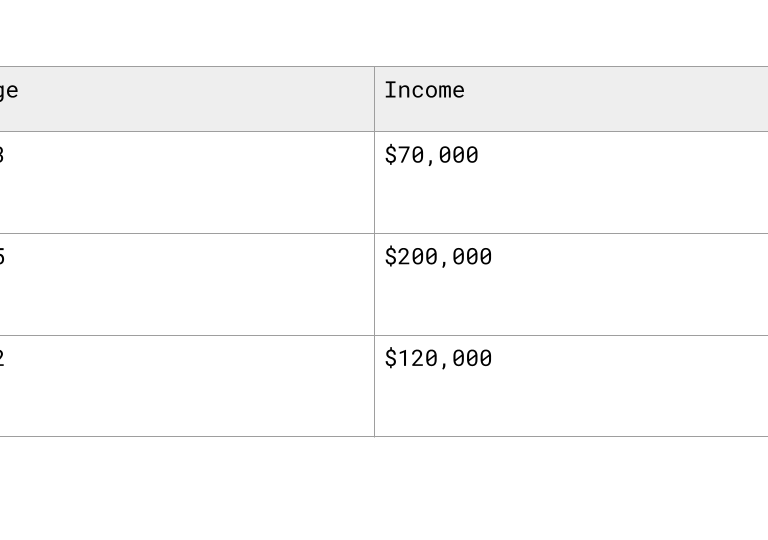
When your data includes numbers—like age, income, or number of purchases—some of those values might be on very different scales.
For example, let's say you have a dataset where ages range from 20 to 80, while income ranges from 0 to 200,000+.
This can cause problems, especially for models that are sensitive to the scale of the input.
Some models (like k-nearest neighbors, support vector machines, or gradient descent-based models) use distances or weights to learn from the data.
If one feature has much larger values than another, it can dominate the model—even if it’s not more important.
Common Methods:
Min-Max Scaling:
Transforms values to a fixed range—usually 0 to 1—by rescaling based on the minimum and maximum values in the column.
Z-Score
Standardizes values by centering them around the mean with a standard deviation of 1, showing how far each point is from the average.
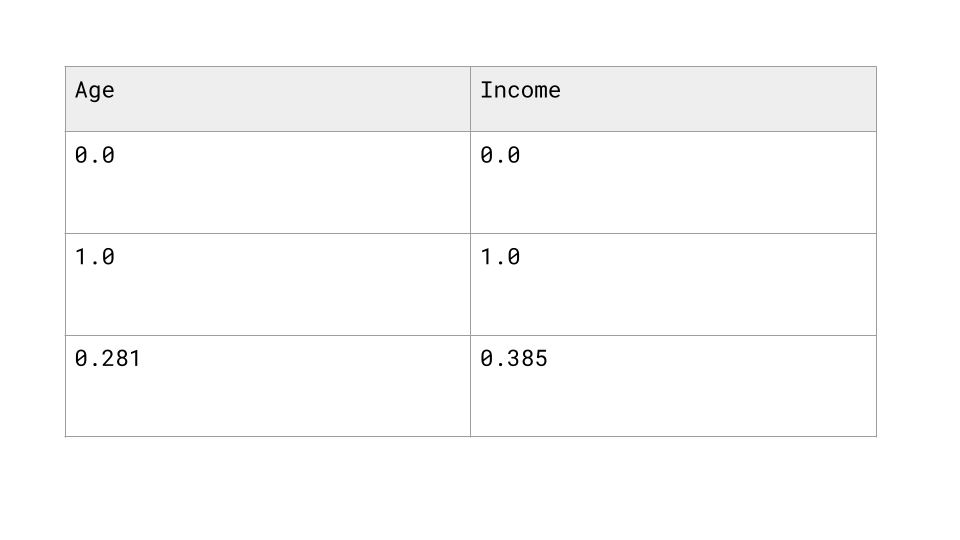
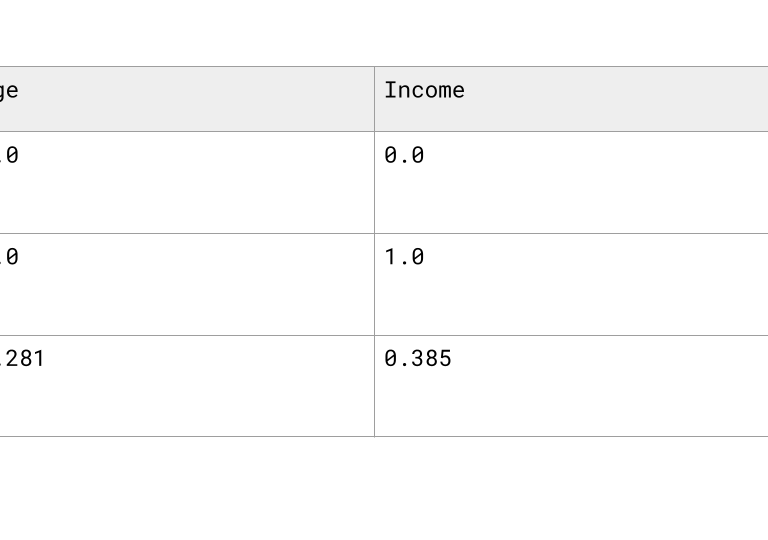
Normalized (via Min-Max Scaling)
Raw Data
Detecting and Handling Outliers
Outliers are data points that are very different from the rest of your data. For example, if most customers spend $20–$200 and one person spends $10,000, that’s an outlier.
Why Do Outliers Matter?
They can skew your results—especially averages, regression models, and distance-based algorithms.
They might represent errors, like a data entry mistake (e.g., typing 10000 instead of 1000).
Or they could be real but rare cases, which you may want to study separately.
How to Detect Outliers?
Boxplots: Show how data is spread and flag outliers as dots outside the “whiskers.”
Histograms: Help you see unusual peaks or extreme values.
Z-Score: Measures how many standard deviations a value is from the mean.
Typically a z > 3
How to Handle Outliers
Option 1: Remove Them - If the outlier is clearly a mistake or very rare and hurts model performance, it might be best to drop it.
Option 2: Transform the Data - Use log transformation or scaling to reduce the impact of extreme values.
Option 3: Cap the Values- Set extreme values to a max/min threshold (e.g., set all values above the 95th percentile to the 95th value).
Bottom Line:
Outliers aren’t always bad, but they require attention. Whether you keep, adjust, or remove them depends on your goals and what they represent in your data.
Connect with Me!
LinkedIn: caroline-rennier
Email: caroline@rennier.com